
Let´s talk digital networks! But not exactly information or neural networks, neither the networks build from marketing places for work, such as Amazon´s Mechanical Turk, Lucid, YouGov, CrowdFlower or Prolific. I want to talk digital networks both “as captured by digital data”
(see the work of Tommaso Venturini and colleagues) and as sites for close reading issue spaces. To do that, I will take advantage of force-directed layouts when reading networks – in particular ForceAtlas2 (Jacomy, Venturini, Heymann & Bastian, 2014), and explore data analysis techniques that go beyond the graphic representation of the network. These objectives may sound naive, simple or even meaningless for network researchers. Especially when statistical calculations can certainly provide more accurate answers, right? At least, this was my impression when attending IC²S² 2019, also what many computational social scientists there expressed in different presentations. What struck me most was seeing formulas, techniques and the strong dependence on statistics and LARGE datasets overshadowing the “social” in computational social sciences. The way our actions/activities are delineated-inscribed-rearranged into-by social media and platform mechanisms were mainly overlooked and most of the time ignored.
Against this background, and back to the purpose of this post, my idea is to seek for an alternative and balanced proposal to read robust and narrow views of collective life through digital networks. I´d like to call attention to what precedes the final and often beautiful visualization of a given network, and what takes place with and through its analytical process (Omena & Amaral 2019, forthcoming; see also Omena & Pilipets 2019) [1]. Query design, data extraction techniques/tools and the relational nature of online data are fundamental elements in this process. To address the question of “what precedes and takes place”, I’ll start by a brief discussion about a fundamental notion in the process of reading digital networks – also a form of grasping the technicity of web platforms: grammatisation.
After that, the case of three different networks will be exposed: 1. the historical network of “climate emergency” images and related link domains (from 2008 to July 2019) – more precisely the vision of what Google Images recommend when one searches for “climate emergency” overtime and challenges for interpreting this type of network [2]; 2. the Instagram following network of Bolsonaro non-official campaign accounts – an exploratory path to study political communication strategies combined with social media programmability and the agency of botted accounts; and finally 3. the image circulation network of Instabots – or the exercise of reading networks afforded by computer vision APIs, in particular building a network based on the feature full matching image; part of the “Web Entities and Pages” module of Google Cloud Vision API [3].
Before we start, let me say an important note: I´ll not address everything that matters for reading digital networks, the point here is to touch what disturbs or what is uncertain (and maybe unnecessary) in reading digital networks; to question “what if”; and to share insights.
Platform Grammatisation & Data Relational Nature of Digital Networks
Undertaken as the techno-materialization process of online activity, and delineated by software, platform grammatisation [4] entails processes of description, formalization and discretization of digital activity. How actions/activity are recorded, registered and organised? How platform mechanisms intervene in this process? What happens after data capture? I do not intend to respond to all these questions, but rather then pointing out a theoretical perspective which is probably not enough to cover them, I will bring some notes and impressions based on ongoing and exploratory research.
An understanding of platform grammatisation relates to technical and practical knowledge over software functioning (integrated with its use). For instance: a good perception on how application programming interfaces govern both end-user and back-end interfaces; how the logic of image recommendation of Google works; how force-directed algorithms spatialise networks; and how to take advantage of software extraction and visualization for studying the grammars of web platforms. All these hows not only take place in digital methods-based research, but intervene-mediate how we see things, how we think or question socio-techno formations. So, instead of only viewing web platforms & software as harmful, bias, or places of distrust, we should shift this vision by looking at the integration of web platforms (software in its full potential) with how ‘people’ (different stakeholders actually) feed and use them. A good start for that is the continuous practice of collecting-mining-analysing-visualising online data combined with a close observation on the platform changes over time. This attempt to understand such encounter/negotiation as a (constitutive) reality is also an exercise of grasping the technicity of web platforms.
I argue that the awareness of platform grammatisation and technicity complement one another; the technical & practical knowledge required for such understanding are crucial for social media research. To account the technicity of web platforms is to embrace a journey of integration and realisation; between us, software and a given context and period of time [5]. That is the opposite of ignoring the ways (or methods) of expression of platforms, or of advancing digital research ‘disconnected’ to these modes. By following platform technicity, we change for better the way we read-interpret-analyse the relational nature of online data; the representations of collectively formed actions; the formations of issue networks.
In this background, another important question is: how can we read digital networks? [6] In collaboration with Inês Amaral, we tried to add value to visual network analysis by accounting platform grammatisation, Gephi affordances and the narrative potential of the spatialisation of the network (book chapter to be published in Portuguese!). We introduce our theoretical-practical proposal on how to interpret a force-directed layout algorithm – in particular forceatlas2 [7]; which we summarise as a narrative thread that has fixed layers of interpretation (centre, periphery, mid-term and isolated elements) but multiple forms of reading. This statement responds to the functional work of forceatlas2 in practice; tested with different platform data and digital networks (those emerged from API calling and those build up on the affordances of digital data and software).
Given this brief introduction, let´s move for the three different networks.
1) The domain-image network of Climate Emergency from 2008 to July 2019 through [Google Search Results]
How can we repurpose Google search results for studying the history of an issue? What are the actors responsible for the dominant visuality of a given issue (e.g. top 100 results)? What can the historical visuality of an issue tell us about society?
These are the questions that served as a baseline for exploring the network of the actors (link domain) responsible for the dominant visuality of climate emergency through Google Image search results over the years. My curiosity about this network was first trigged at DMI Summer School 2019. One of the aims of the project was to perceive the different climate frames through Google Images. The proposal was to address the visual history of “climate change”, “climate emergency” and “climate crisis” (see the report here). We have also detected the link domains that appeared constantly in the top 100 results over 10 years, and the emergence of new actors. To do that, we visualised separately the link domains (with a RankFlow viz) and the top 10 images (details & methodology here). Very helpful in this process was to print the visualisations (see below).

But, of course, I was not fully happy with the results. Why? Because images and link domains were separated, so was the final vision we had about climate. Despite the very rich historical perspective achieved by repurposing Google Search engine (taking advantage of lists of image URLs), and although I would recommend or repeat this technique for different purposes and studies. I started questioning myself whether it would be possible to build a network capable of illustrate the visual history of climate emergency, and, at the same time, inform the actors and related year. So, I decided to build an image-domain net from scratch, downloading ALL THE IMAGES (the top 100 year by year; from 2008 to July 2019) again and preparing everything – from images folders to spreadsheet. Yes, laborious work. Of course there was no time to experiment and explore at that day the network was built, only after a certain time.
- Download the top 100 images year by year with downthemall (but Chrono Sniffer can also do this work). why? by saving them in different folders, I was able to create a column named ‘year’ in my spreadsheet, and later use this column as timing parameter.
- Build the spreadsheet with four columns: id, actor (link domain), img, year.
- Use Table2Net to create a bipartite network (nodes as both domains and images).
- Year as domain nodes attribute.
- Use the Gephi plug-in ImagePreview, to visualise the images.
[detecting the main actors – -> ForceAtlas2 + Network Splitter 3D]
The exploratory journey begins with the gexf. file in hands (it is not that I have the correct answers, but what comes next, I believe, it makes sense). So, after trying out Gephi’s ForceAtlas2, Circular and Isometric layouts, I found in the 3D proposal of NetworkSplitter a very good option to visualise & detect the most prominent link domains responsible for the visuality of climate emergency suggested by Google Search results (see below).

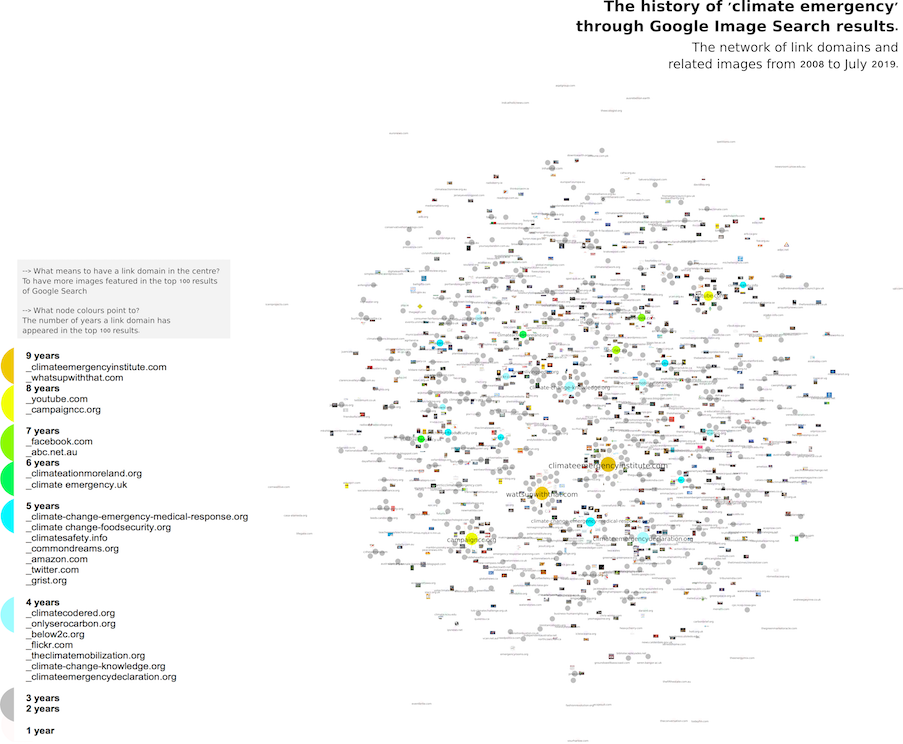
The network of climate emergency related actors & images from 2008 to July 2019
according to Google Search results.
Highlighted in the network above is the group of actors who have consistency over many years not only generating images related to climates emergency, but in featuring those images in the top 100 results of Google Images. The colours of the nodes represent my rapid analysis or attempt to categorise the types of domains: from climate change related pages and social media to news and others. It is very probable that these suggested categories may gain another shape if reviewed by Climate Change expert or scholar. The focus here was to figure out how to identify with precision the dominant actors over years through a network (in terms of consistency over time, not in top ranked position). Yes, I do think this approach was indeed valid and perhaps even more complete than the one with the rank flow technique (this latter requires more time for the analysis).
[detecting the main actors and related images]
After identifying the actors, the challenge was to return to ForceAtlas2 and try to read the network (now accounting the images!). Can we explore the narrative affordances of ForceAtlas2 in historical networks of link domains and related image? Since we are handling with very specific connections in this bipartite network – images (one type of node) that belong to (edges) a given link domain (another type of node), I thought it was quite tricky to interpret the position of the nodes within this network. Indeed, a designer could argue that this is not the best visual solution, but what visualization could put together ALL ACTORS & IMAGES & TIMING at once? In Imageplot, for instance, we could visualise the images according to a time perspective (x axis) and anything that can be measured by numbers (y axis), e.g. nº shares – which is not the case here, because we wanna see image and related years + actors. ImageSorter would only provide a collection of images. An image treemap would require a numerical parameter to size the different spaces in the map – in the ‘climate emergency’ case would be probably number of years or frequency of a given image category (e.g. protests, graphics, books related to ‘climate emergency’). This latter, actually sounds a very good option to provide a thick description of ‘climate emergency’ visuality, but the collaboration with climate change experts or scholars seems to be mandatory for this sort of analysis.
Back to the question of exploring the narrative affordances of ForceAtlas2 in historical ‘climate emergency’ network of link domains and related images, we see below that nodes are located – from the centre to the periphery of the network, according to the number of their connections. This somehow make sense and follow the algorithmic logic of forceatlas2. However, considering that we are seeing particular link domain connections, this network lacks the common characteristic usually found in social graphs: the presence of edges connecting different nodes within the whole network. For this reason, the multiple forms of reading and possible interpretations afforded by the connection between nodes were ignored.
What did I do? I follow the affordances of Table2net & Gephi to colour the nodes according to years. In other words, the identification of how many years a given link domain have its image featured in Google Search top 100 results. For this purpose, a domain-image net seems to be just perfect to analysis (see the dataviz below).
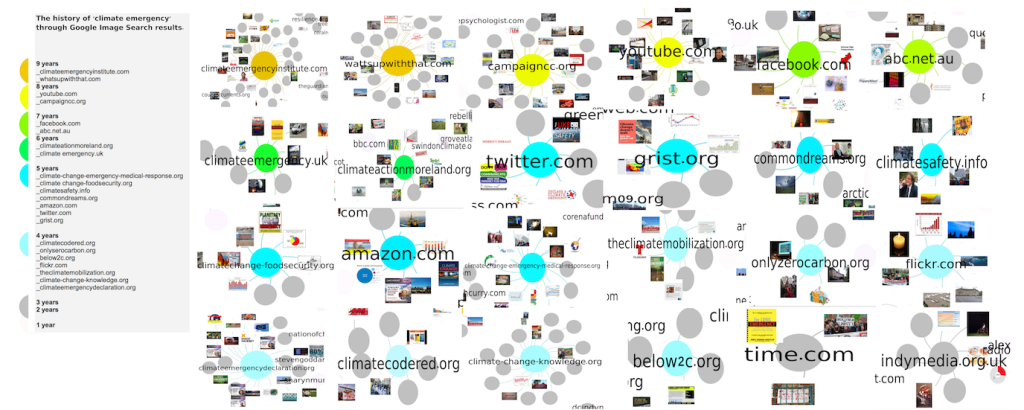
Rather than drawing attention only to images (or only to actors) and timing perspective, what we see in the chronological network of “climate emergence” demonstrate how time (years), actors and images are related, entangled, connected. Further analysis, in collaboration with a Climate Change scholar or expertise, must be done here.
Considering the affordances of Google Image Search results, this very same technique can be replicated with different keywords, such as ‘abortion’, ‘microcephaly’, ‘Bolsonaro’, ‘LGBT’, ‘porn’, etc.
2) The following network of Bolsonaro non-official campaign accounts in October 2019 through [Instagram suspicious account names]
Considering public or suspicious username accounts, what can we learn from social media following networks? What visual stories a list of username accounts and related image profile URLs can tell about political positioning? Can we repurpose the image profiles of non-official campaign accounts: i) for understanding far-right debates & ideologies & visualities in Brazil? ii) for studying political botted accounts on Instagram?
What follows are the results of a research practice that attempted to repurpose social media recommendation system (when searching for “Bolsonaro” videos on Instagram) and the grammars of web platforms (a list of usernames & image profile URLs that result for the search activity) for the study of political botted accounts on Instagram. The starting point here relates to Bolsonaro ‘non-official’ campaign accounts such as bolsogatas_oficial, bolso_frases, bolso.memes, bolsomito_oficial, etc. Why? These type of accounts tend to rely on automated engagement practices. Furthermore, Bolsonaro ‘non-official’ campaign accounts heavily rely on automation to spread not only a far-right political ideology in the country but disinformation. This exploratory case was guided by the following objectives and questions:
[objectives]
- To explore visual political communication in social media through Instagram recommendation system.
- To grasp the agency of botted accounts in order to understand the black market of social media engagement (see previous research here and another exemple here).
[questions]
- How Bolsonaro non-official campaign accounts behave and connect to one another?
- What image profiles can tell about automated practices and the visualities that support Bolsonaro?
25 username accounts (see the list here) served as a entry points to trace and extract all their following network. Most of these 25 accounts were suggested by Instagram algorithms after I clicked in a Bolsonaro’s video content: actually I was following a hashtag content recommendation (#bolsonaropresidente). After the first click, I’ve just scrolled down and navigated the suggestions; writing down the name of accounts recommended by Instagram. The other accounts, part of the 25 entry points, were added both with basis in previous case study and by seeking connections with ‘mulheres’ (women) or ‘trump’ and ‘bolsonaro’.
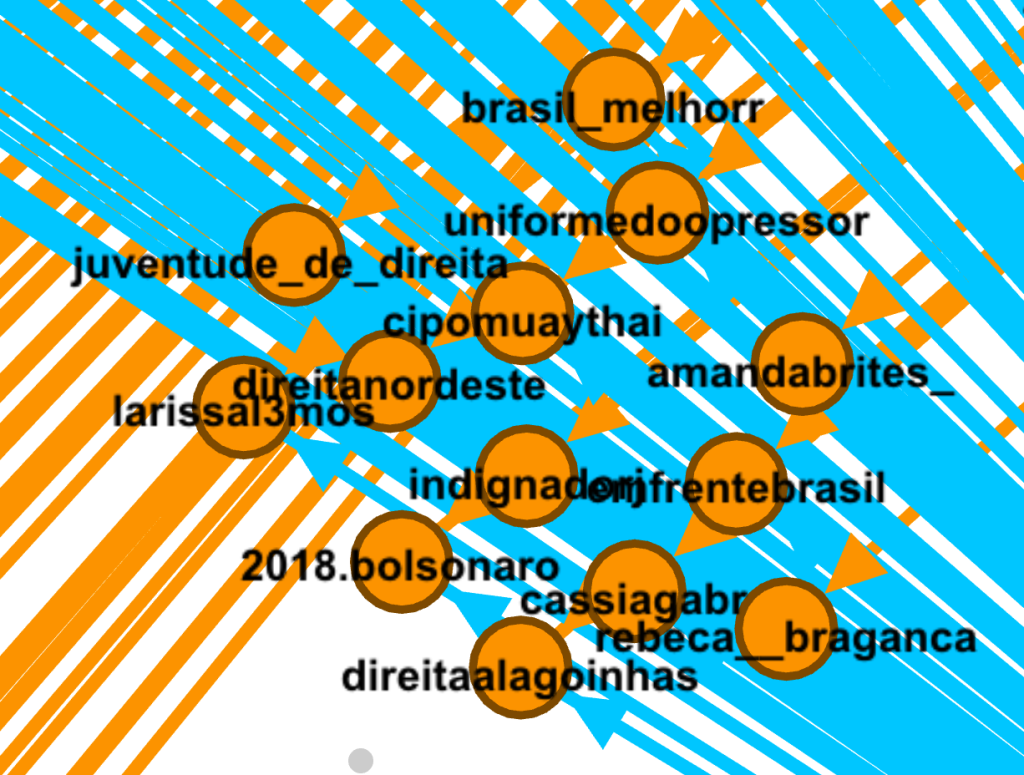
Some insights emerged through the following network of BolsoBots on Instagram. The first concerns the main node within each cluster (dedireitabr, ideologiabrasil, bolsomito_oficial, umconservador, bolsogatas_oficial and nordestebolsonaro) which, despite not following one another, these accounts (nodes) share interests in very specific groups of Instagram profiles. For instance, see the shared interests between: direitabr & ideologiabrasil; direitabr & nordestebolsonaro; nordestebolsonaro & umconservador; umconservador & bolsomito_oficial. All these connections, beyond pointing to ordinary usernames, also guided the detection of a repetitive pattern through usernames; something that fulfils a ‘non-official campaign’ stereotype profile. That is the case of usernames constituted by: the combination of “bolsonaro” and its presidential campaign number (17) or year (2017, 2018, 2019) or “women” or Brazilian cities; a right-leaning indication (direita); and the name of the country (Brazil).

Starting point: 25 Instagram suspicious accounts. Gephi for visual network analysis. ForceAtlas 2 for spatialisation: 27.742 nodes (usernames) and 31.395 edges (connections indicate the act of following an Instagram account).

A second insight, following the narrative affordances of forceatlas2, concerns the type of accounts that raise interest in the whole network. That is, in the centre of the network, the connections made by brasilmeupais_verde_e_amarelo, verdade17 (this account no longer exist!), bolsopress (this account no longer exist!), bolsolindas, bolsonaromaromba, foracorruptosoficial and luta_brasiloficial; such connections spark interest among the main nodes within each cluster positioned in periphery area (dedireita, ideologiabrasil, bolsogatas_oficial, bolsomito_oficial and nordeste bolsonaro). These latter accounts share similar visuality and communication strategy (see below); following up with political discussion in Brazil and positioning all sort of information in favour of Bolsonaro – with different styles (e.g. humour, clickbait, aggressive or more formal style).
The non-existence of accounts such as verdade17 and bolsopress not only indicates the fluid mode of existence of botted accounts on Instagram but also their ephemeral nature and great ability to produce-distribute content and disappear. There is simply no other way of grasping this flow of ‘non-official political accounts’ but by monitoring and tracking.
See below the visual style of BolsoBots accounts on Instagram. The connections made by the accounts located in the centre of the network (e.g. brasilmeupais_verde_e_amarelo, bolsolindas, bolsonaromaromba, foracorruptosoficial) spark interest among the main nodes within the clusters positioned in periphery area of the network.

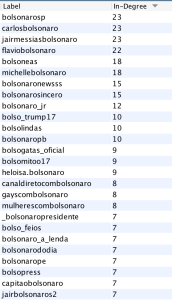
On the left, the most popular Instagram accounts among the 25 entry point accounts – in terms of ‘being followed by’ (in-degree).
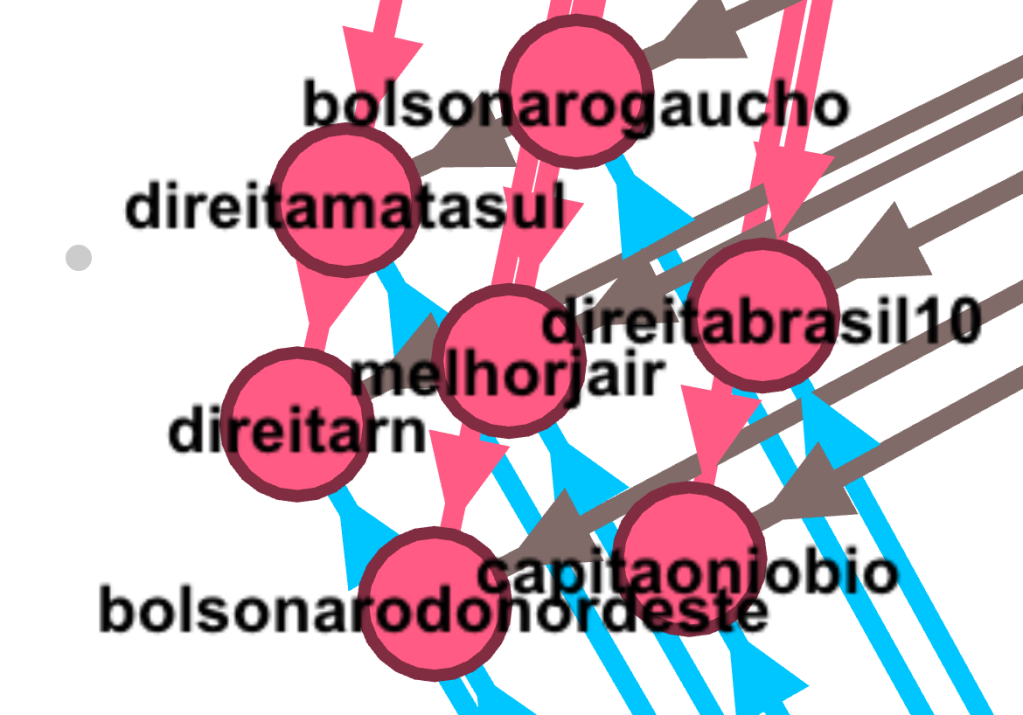
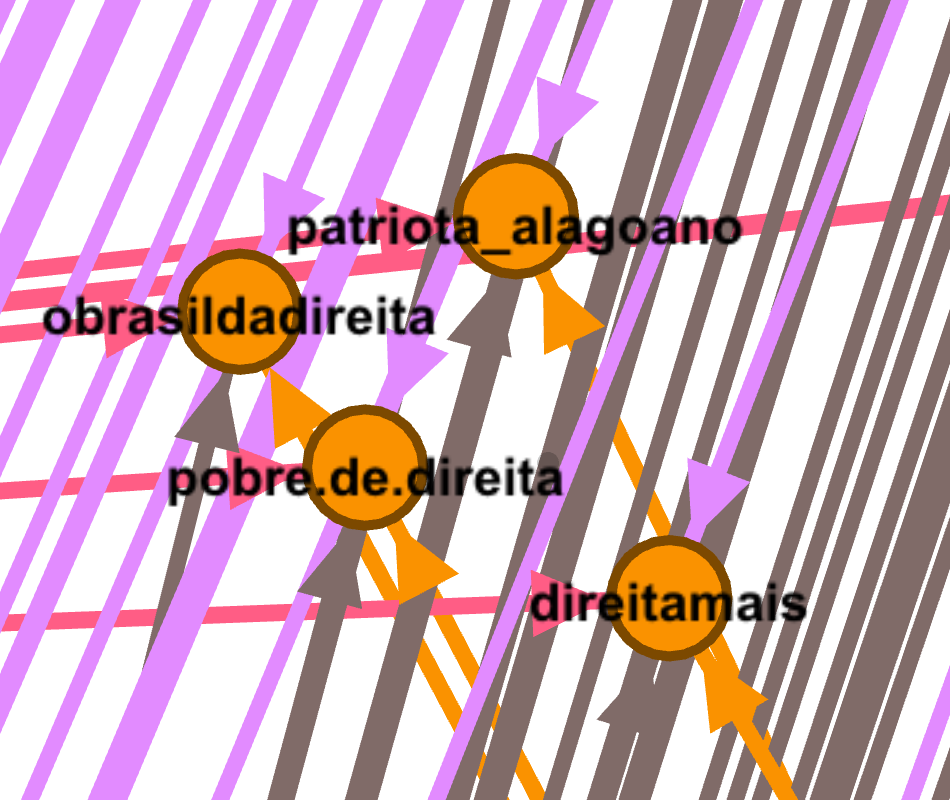
A third insight derives from the bridging accounts (nodes) positioned in the mid-term area of the network. For instance, bolsonarosempre, bolsomitobrasil, nordestinoconservador, wilebolsonaro (this account no longer exist!), psl_bahia, shift.technologia (among others to be explored); these accounts (in the mid-term left) are the meeting point of nodes positioned in the centre, direitabr and ideologiabrasil. Such connections seem to be irrelevant (or random), but when looking at the mid-term right side, we find small clusters of Instagram accounts that are followed by direitabr, nordestebolsonaro, umconservador, bolsomito_oficial and some accounts located in the network central zone. These bridging clusters (image below) indicate an army of Instagram non-official campaign accounts; in which we see humour (e.g. pobre.de.direita, bolsonarozuero), Brazilian cities and regional characteristics, and countries (e.g. bolsonarobrasilia, patriota_alagoano, bolsonaro_soteropolitano, jairbolsonaroportugal), women representations (e.g. garotareaca, mulheres_com_bolsonarooficial), and right-leaning positioning (e.g. somosdadireita, conservadoresbrasileiros, direitamais).


In the periphery zone we see the accounts that are exclusively followed by direitabr, ideologiabrasil, nordestebolsonaro, bolsomito_oficial and bolsogatas_oficial. I´m not disclosing further details about such specific connections (yep time constraints), but I can tell one of the main patterns is the presence of ordinary Instagram accounts (something expected).
The insights presented here are just starting points for the exercise of mapping bolsobots on Instagram. This first network had actually served the purpose of building a second following network. Why? Because through the first network I was able to detect 833 non-official campaign accounts; that is to say an army of very likely political botted accounts that have been playing an important role in content creation and distribution. The problem of these accounts is not because they support a cause or a person, but observing how they intentionally (and very easily) blacken the reputation of public figures and established movements (such as LGBT & Feminist). These type of accounts, furthermore, are well-known by spreading disinformation.
What did I do exactly to build the second following network?
→ In Gephi, I exported the node file in excel file.
→ Than I opened the file (in Excel or Google spreadsheet) and filtered username accounts according to the following keywords: ‘bolsonaro’, ‘bolso’, ‘direita’, ‘brasil’, ‘mulher’, ‘lgbt’, ‘gay’, ‘conservador’, ‘familia’.
→ With the results provided by the filtering exercise, and after detecting only unique accounts, I added the new usernames in the first list of accounts; creating in this way a second and more robust list of Bolsonaro non-official campaign accounts 🤓😃
→ After that I started the process of tracing the following network of 833 new accounts (still collecting data!); a new following net is to be built and analysed.
The next question is: considering image profile URLs, what is the visuality of the following network of Bolsonaro non-official campaign accounts? What are the visual stories that image profiles can tell about political positioning?
Below you see 22.351 image profiles emerged from the following network of BolsoBots. This strategy of plotting a collection of images was very helpful to find patterns based on colour and image repetition. In a general overview, we first notice the colours of Brazilian flag (yellow, green and blue). This visual representation was already expected, considering the colours that stand for each “side” in Brazilian political polarisation context: yellow (or Brazilian flag colours) vs. red (or LGBT and Feminism related colours and aesthetic). The considerable number of image profiles in yellow, green and blue may point to a high number of botted accounts. The colour red (not exactly expected here) relates to direct criticism to the Workers Party (Partido dos Trabalhadores – PT) and its supporters. It is also a visual strategy that aims to blacken PT reputation.
Another visual aspect that immediately had called my attention was the presence of discrete bots (read more about this particular bot agency here). On Instagram, discrete bots exist to give likes (sometimes they follow others) but they do not create content (they not even have an image profile!). Consequently, the discrete mode of bot existent serves the purpose of boosting engagement without attracting attention (see Omena, Chao, Pilipets et al. 2019).

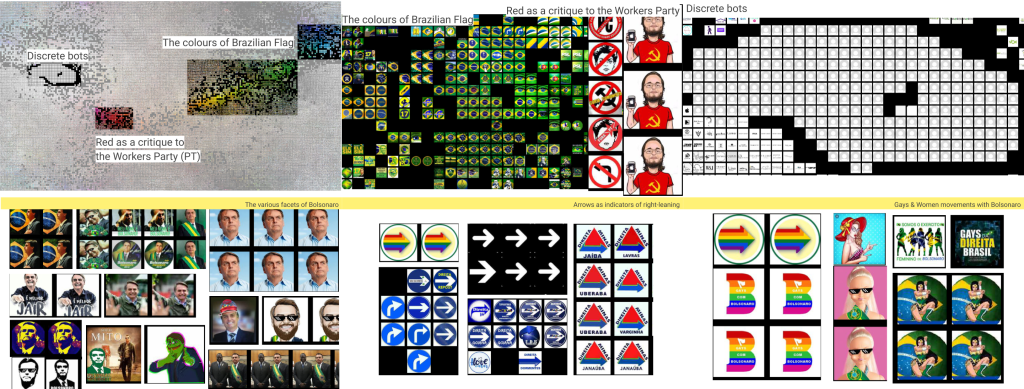
After navigating through this collection of images, the main strategy was finding patterns based on colour, image repetition and an intuitive navigation (afforded by ImageSorter). In this way, and avoiding images with people [8], the various facets of Bolsonaro came out: the president of Brasil a patriotic man (standing straight and looking forward with the Brazilian flag in the background); as man of faith (wearing a blue shirt with the sky background); as an action film star; as a funny person: as Pepe the frog; as symbol of pop art (more images here).
The various facets of Bolsonaro are verified here through image profile URLs, however these different facets were earlier detected through username patterns in the following network (the bridging clusters in the periphery zone). These findings exposure a standard behaviour for Bolsonaro non-official campaign political accounts on Instagram; also indicating that username patterns and image profile can provide rich insights.
A series of profile images with an arrow as an indicator of right-leaning were also identified. The arrows refer to a visual positing effort which speaks on behalf of different states and cities in Brazil, such as Pernambuco, Minas Gerais, Goiania, and also the gay community (due to the reference of the rainbow colours). This latter finding is complemented by very specific visual representations which concerns the Gays & Women movements as Bolsonaro supporters. That is strongly believed for many to be very contradictory, due to the president public statements about LGBT community and he beliefs about the role of women in society.
By taking suspicious usernames accounts as keywords and by accounting image profile URLs as source for social enquiry, I hope that the exercise proposed with following network of Bolsonaro non-official campaign accounts can serve as basis and example for further research and practices.
3) The image circulation network of Instabots through computer vision API [Google Cloud – Web Entities and Pages]
[digital networks] How can we read Vision API-based networks? [digital methods] How can we think and visualise the degrees of automation of bot engagement on social media? [bot visuality & image circulation] How does the visuality of botted accounts travel across domains?
Following the logic of ForceAtlas2, and considering my first contact with a network built upon Google Cloud web detection module – full matching images, the main challenge was to understand how to read the spatialisation of this network. Why? Due to the very complex process attached to this type of network, in which nodes are both images and the link domains where these images have circulated (minimum one, maximum 10 different link domains) – read the context and study in which this network took part of here.

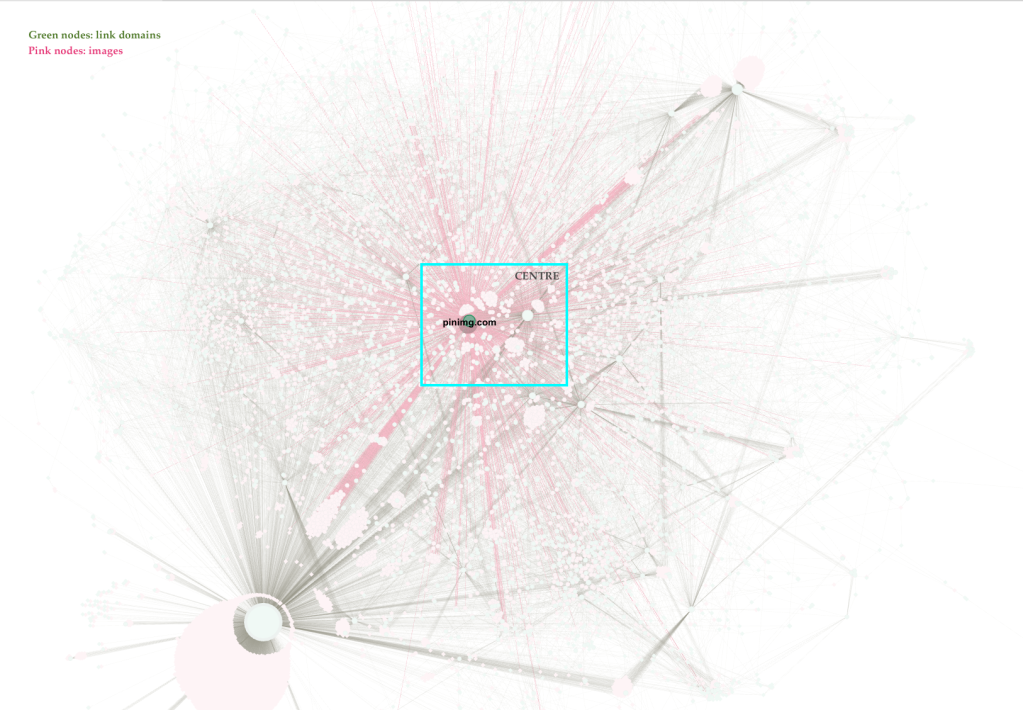
The image-domain network of Instagram and Tumblr botted accounts afforded by computer vision. Nodes are images and link domains (a total of 14788), edges (a total of 33.503) indicates whether a given image happened to appear in different domains. Source:DMI Summer School 2019. Bots and the black market of engagement. Analysis by Janna Joceli Omena, Jason Chao, Elena Pilipets, Bence Kollanyi, Bruno Zilli, Giacomo Flaim, Horacio Sívori, Kim van Ruiven, Lieke Rademakers, Mengying Li & Serena Del Nero.
In the centre of the network, the most connected nodes in terms of variety/diversity. That is, on one way, the link domains that shared images with a large variety of other links domains positioned in different areas within the network. On the other way, in the centre we also see (clusters of) images shared by different link domains positioned in the mid-term or periphery areas of the network, just as (clusters of) images that appear exclusively in a given central link domain.

In the mid-term field of the network we start seeing more specific connections that point to particularities that concerns nodes located in the periphery area. In other words, we see what connects link domains or image clusters to the central nodes. For instance, how wordpress.com shared a very particular visuality with cdn.instagram, while visual content of this former is partitioned with different link domains in central area of the network. We can also identify bridging image clusters, for example the imagery shared between Tumblr and the central link domains.
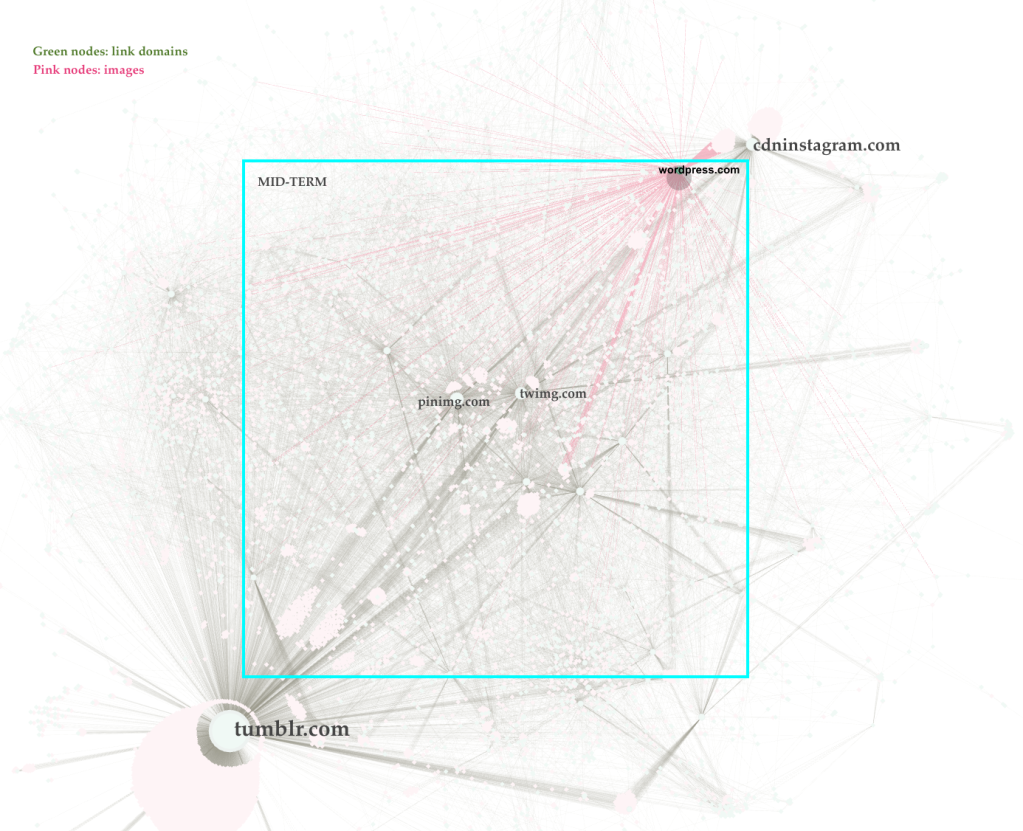

Particularities and specificities are located in the periphery zone of the network, there we can clearly detect what sticks and what flows out of a given link domain; meaning a very rich vision on platform-imagery-specificity; understanding what visualities circulates within the platform and what visualities go across platforms. That is the case, for instance here, of Tumblr and Instagram bot visual content. We see also image clusters (or domains) that have peculiar connections, not necessarily linked to the central zone of the network.

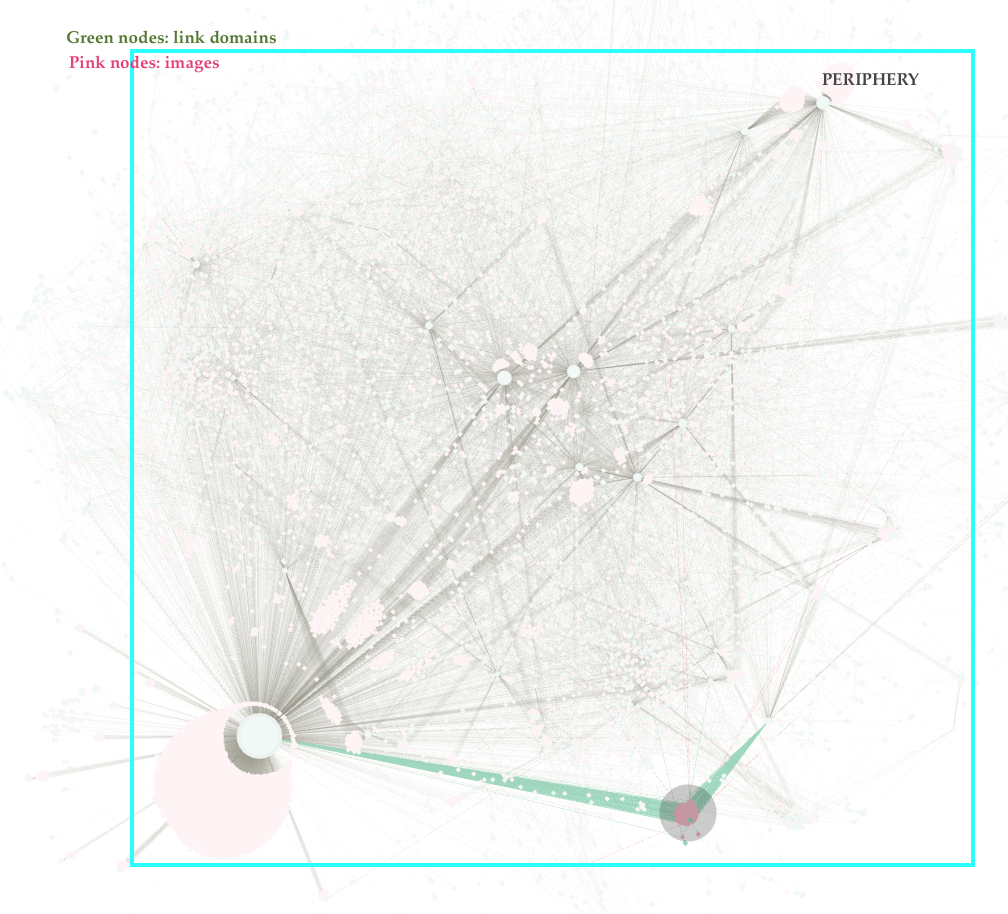

In the zone of isolated elements, there are unique or isolated appearances and unique or isolated connections between images and link domains. For example, when an image only takes place in one link domain (or just in a few more) or when a link domain appears only once.
These fixed layers of interpretation (centre, mid-term, periphery, isolated elements) provide an in-depth comprehension about the meaning and weight of the connections within the network; exposing different visions and perceptions according to what precedes the creation of the network file (e.g. gdf.). Rather than only focusing on cluster formations, these layers allow both thick descriptions of the whole and the parts as well as provide different starting points to the analytical process. In other words, multiple forms of reading.
With this in mind, and getting advantage of two incredible weeks of work in CAIS with Elena Pilipets, as a visiting fellow, we started the hard work process of reading this vision api-based network for understanding social media bots agency (via image circulation). What we did? We opted to look at the periphery zone, in particular to what visuality sticks within Instagram and Tumblr and what visuality flows out of these platforms.

One of the main findings was identifying two modes of existence of Instagram botted accounts:
–> The discrete bots that give likes (sometimes they follow others) but do not create content; serving the purpose of boosting engagement without attracting attention.
–> The imitative bots that mimic real people by distributing mainstream or business or branding content; serving as aggregators of followers or following, as well as for giving or receiving likes.
These findings were validated by the analysis of the visuality that sticks within Instagram and what flows out of it; the starting point of this analytical process was the periphery zone of the network in which we clearly see images that only circulated within Instagram and those ones that had appeared in different link domains (located in different zones of the network). Such decision does not cover all the stories this network can tell or disclose, but it gives a more effective response to what we were looking for. Of course, new questions have emerged. Of course, we did not have time to go for all new demands. But what matters the most in reading a digital networks is the awareness of its potentialities; the capacity of reading its graphical representation; and the confidence in choosing an appropriate view and trajectory to be analysed.
Back to the findings and the rich insights, we noticed a social media domain-triangle that uncover a shared visuality among Facebook, Instagram and Twitter. This is where we deal with Instagram ghost accounts; the discrete botted accounts, with username pattern as mainly numbers and underscores; take part in public conversations or debate without being noticed or detected.

The imagery that sticks within Instagram is very diverse: Asian girls, babies, dogs, food, selfies, cars, including some memes, nature and promotion. A lousy visuality for Instagram has definitely called our attention. When looking at the centre of the network, the visuality that flows out of Instagram is dominated by memes and it circulates among different social media (Facebook, Tumblr, Pinterest, Twitter, and in a minor scale Reddit), image repositories (including meme and clickbait sites) and other domains.


Considering the variety of images and also link domains, the strategy was to closely look at the frequency of bot usernames attached to a given image (a node property intentionally added in the csv. file that has built this network). When seeing the usernames linked to Tumblr and Pinterest, we detected a particular bot visuality that corresponds to each platform-specificity: from small business imagery to memes and erotic gay boys related-pictures.

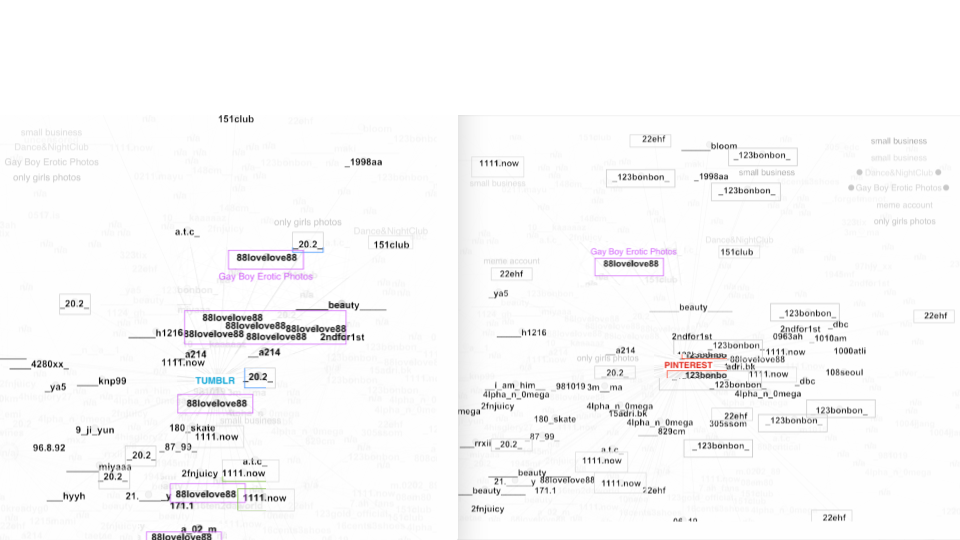
The visuality attached to Pinterest tend to be created by small bot business accounts, while the occurrences of gay boys images (by @88lovelove88) is higher on Tumblr than Pinterest. Both cases suggest that botted accounts are not only programmed to upload content or to follow trending hashtags in order to reach visibility, but automation also follows and respect social media culture of use.
The beauty of reading networks
Why taking into consideration digital networks? What does it take to build a network? How does the logic of putting pieces together assist the way we interpret networks? What counts in this process? What is the role and narrative affordances of force-directed layouts? Where should we look at to and what should we ignore? (and how actually we make such decisions? Why?). These questions trace back to theory; to applied research with and about platforms & software; to what precedes and takes place in digital networks. That is the beauty of reading networks; a reticular technical-practical-theoretical-contextual structure of thought.
Notes
[1] Inês Amaral and I addressed these questions through proposing a framework for reading digital networks in which we argue the act of reading digital networks may stem from a triple-edge understanding. That is i) a basic understand on how platform databases and activity are delineated, inscribed and made available through software; ii) a grasp of the narrative affordances of the graphical representation, and iii) its the hermeneutics value. This is a forthcoming chapter originally written in English, and later translated in Portuguese for the book “Métodos Digitais: Teoria-Prática-Crítica”, edited by myself, and part of the ICNOVA series of books.
[2] The work on the network of “climate emergency” recommended visuality by Google Images and their related link domains overtime was sparked by the project “Climate Image Spaces and the new climate movements” in the context of DMI Summer School 2019. There, and among other objectives, we interrogated the history of Climate Change images through Google search results.
[3] The model proposed to read this network is an concrete output of my previous research on interpreting the narrative affordances of ForceAtlas2, combined with productive and inspiring discussion in the company of Elena Pilipets and Jason Chao. When opting for the force-directed layout ForceAtlas2, we may want to consider: i) the position of the nodes within a network responds to the forces of regular repulsion vs. repulsion by degree; ii) the data relational nature – how connections are made (if delineated by an API or by pre-defined options when building the network) , nodes or edges attributes.
[4] See the work of Bernard Stiegler on digital grammatisation, Phil Agre’s essay on Surveillance and Capture, and the following articles on platform grammatisation: What Counts? Refelctions on the Multivalence of Social Media Data by Carolin Gerlitz; Tweets are not created equal. A Platform Perspective on Social Media Metrics by Carolin Gerlitz and Bernhard Rieder. Also two forthcoming and co-authored papers: “Sistema de Leitura de Redes Multiplataforma” by Inês Amaral and myself and “Digital Methods for Hashtag Engagement Research”, written with Elaine Rabello and André Mintz.
[5] See the essence of technicity in Gilbert Simondon and also the forthcoming book of Bernhard Rieder – Engines of Order: A Mechanology of Algorithmic Techniques, and hopefully my future PhD dissertation on Social Media Technicity 🤓🙏🙏😏
[6] Have a look at the following must read articles about digital networks:
Venturini, T., Munk, A., & Jacomy, M. (2019). Actor-Network versus Network Analysis versus Digital Networks: Are We Talking about the Same Networks? In J. Vertesi & D. Ribes (Eds.), DigitalSTS: A Field Guide for Science & Technology Studies (pp. 510-524). PRINCETON; OXFORD: Princeton University Press.
Venturini, T., Jacomy, M., & Jensen, P. (2019). What do we see when we look at networks. arXiv preprint arXiv:1905.02202. Retirado de https://arxiv.org/abs/1905.02202
The following presentations may also help:
–> How to read cross-platform digital networks? [slides]
–> Networks, Hashtags, Memes: A quali-quantitative approach for exploring Social Media Engagement (together with Elena Pilipets)
[7] This logic of interpreting the narrative affordances of ForceAtlas2 has been explored not only in data sprint contexts but in my ongoing and exploratory PhD research over the past years. Here it goes a few examples on reading networks through YouTube and Google Play Store as layers of recommendation, also how to interpret Vision-API based networks such as image-label network (label detection) and image-domain network (web detection – full matching images).
[8] Although knowing botted accounts mimic real people accounts, this sort of analytical process is long and exhaustive for one person; it is recommended to involve more researchers – ideally in a data sprint context or working group sections or workshops.
References
Jacomy, M., Venturini, T., Heymann, S., & Bastian, M. (2014). ForceAtlas2, a Continuous Graph Layout Algorithm for Handy Network Visualization Designed for the Gephi Software. PloS One (9)6, e98679.doi:https://doi.org/10.1371/journal.pone.0098679
Omena, J.J. & Pilipets, E. (2019). Networks, Hashtags, Memes: A Quali-Quantitative Approach for Exploring Social Media Engagement. CAIS Workshop, 24 July 2019, Bochum, Germany.
Omena, J.J. & Amaral, I. (2019). Sistema de leitura de redes digitais multiplataforma. In: Métodos Digitais: Teoria-Prática-Crítica. Lisboa: iNOVA Media Lab – ICNOVA.


An interesting discussion is worth comment. I think that you should write more on this topic, it might not be a taboo subject but generally people are not enough to speak on such topics. To the next. Cheers
LikeLike